Gym Reports & Analytics
Pull the reports you need and export them.
Finegym provides detailed reports to analyze revenue, members, attendance, reservations, and referral sources. All reports support date filtering and time grouping.
Sales Report
Location: Reports → Sales
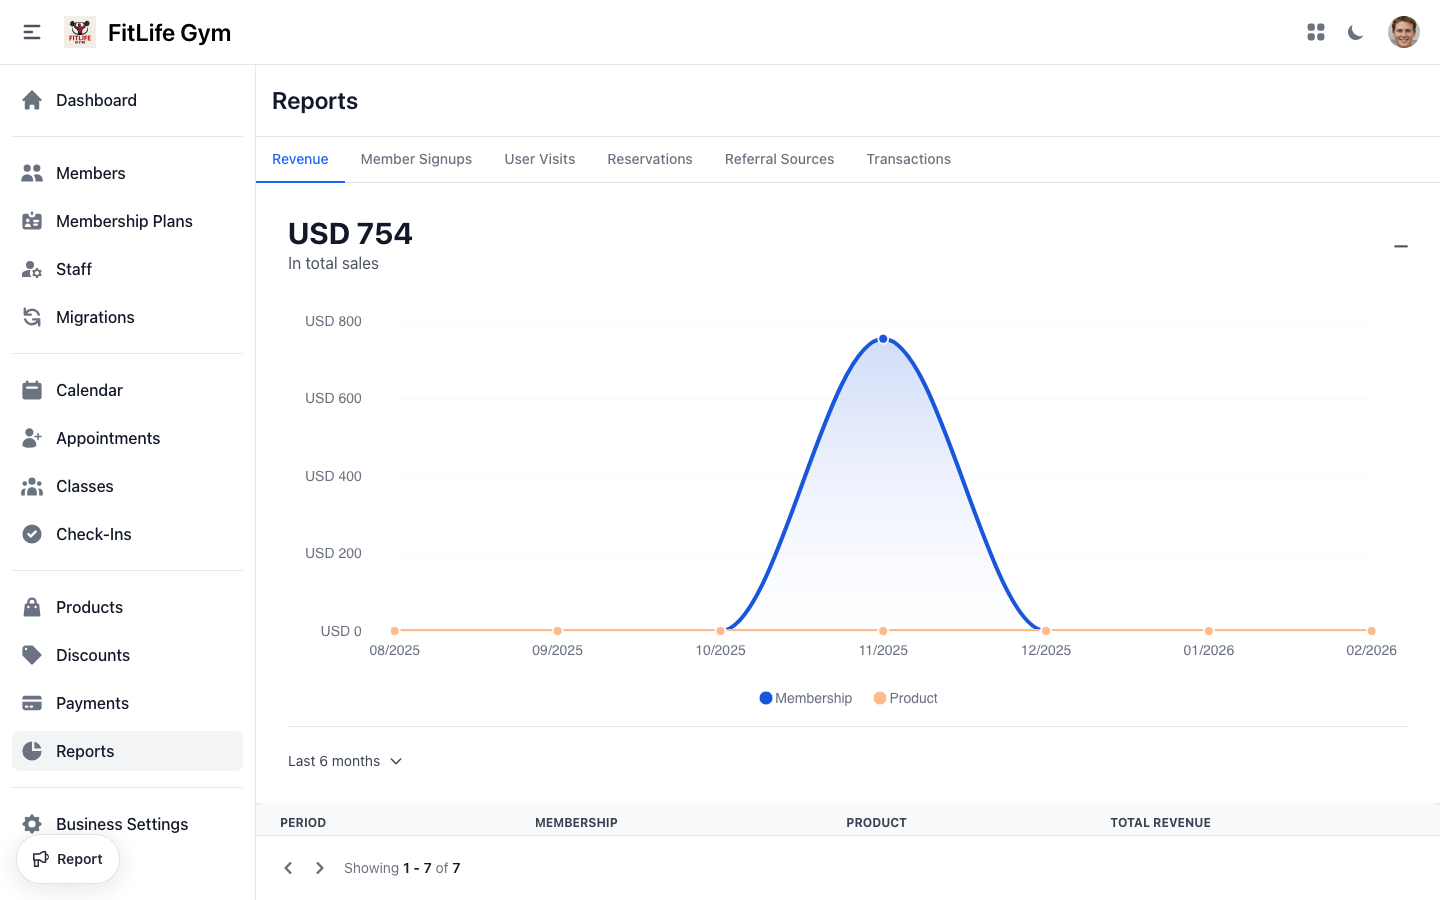
Sales Overview
Track your gym's financial performance:
Sales Source Filter
Choose which part of the business you are looking at — All sources, Memberships, Products, or Appointments. The filter drives the headline figure, the chart, and the table together, so you can answer questions like "what did the shop alone bring in this quarter".
Sales Growth Chart
The headline figure is total sales for the period, with the percentage change from the previous period. The chart plots sales over time, with memberships, products, and appointments as separate series.
Sales Table
- Period — Date or date range
- Membership — Membership sales for the period
- Product — Product sales for the period
- Appointment — Appointment sales for the period
- Total sales — The three columns added together
This report counts payments, and includes tax. Refunds are not subtracted, so a sale that was later refunded still appears here.
For a figure with refunds and tax taken off, use the Transactions report.
Expected Membership Revenue
Forecast recurring revenue:
- Period — Future date range
- Expected Revenue — Projected income
Shows projected income from active recurring memberships and scheduled billing dates.
Transactions Report
Location: Reports → Transactions
Every individual payment as a filterable, exportable list — and, above it, the summary to reconcile against:
- Revenue Sources — Totals per source, with a transaction count
- Subtotal — All payments in the period
- Refunds — Money refunded
- Net Taxes — Tax collected, which you owe onward rather than keep
- Net Revenue (after taxes) — What the business actually earned
Use this report at period close, and the Sales report for trends over time. The two answer different questions, so they will not show the same number.
Member Signups Report
Location: Reports → Member Signups
Track member growth over time:
- Period — Date range
- Count — Members joined
Churn Rate
Also displayed on this page:
- Period — Date range
- Active Memberships — Number of active memberships
- Churn Rate — Membership cancellation percentage
User Visits Report
Location: Reports → User Visits
Track facility usage:
- Period — Date range
- Count — Check-in count
Reservations Report
Location: Reports → Reservations
Track booking activity:
- Period — Date range
- Count — Total reservations count
Referral Sources
Location: Reports → Referral Sources
Understand how members find you:
Displays a pie chart of member acquisition channels with percentage breakdown. Sources are based on the "Referred by" field set on member profiles.
This report supports date range filtering to analyze referral trends over different periods.
Date Ranges & Filtering
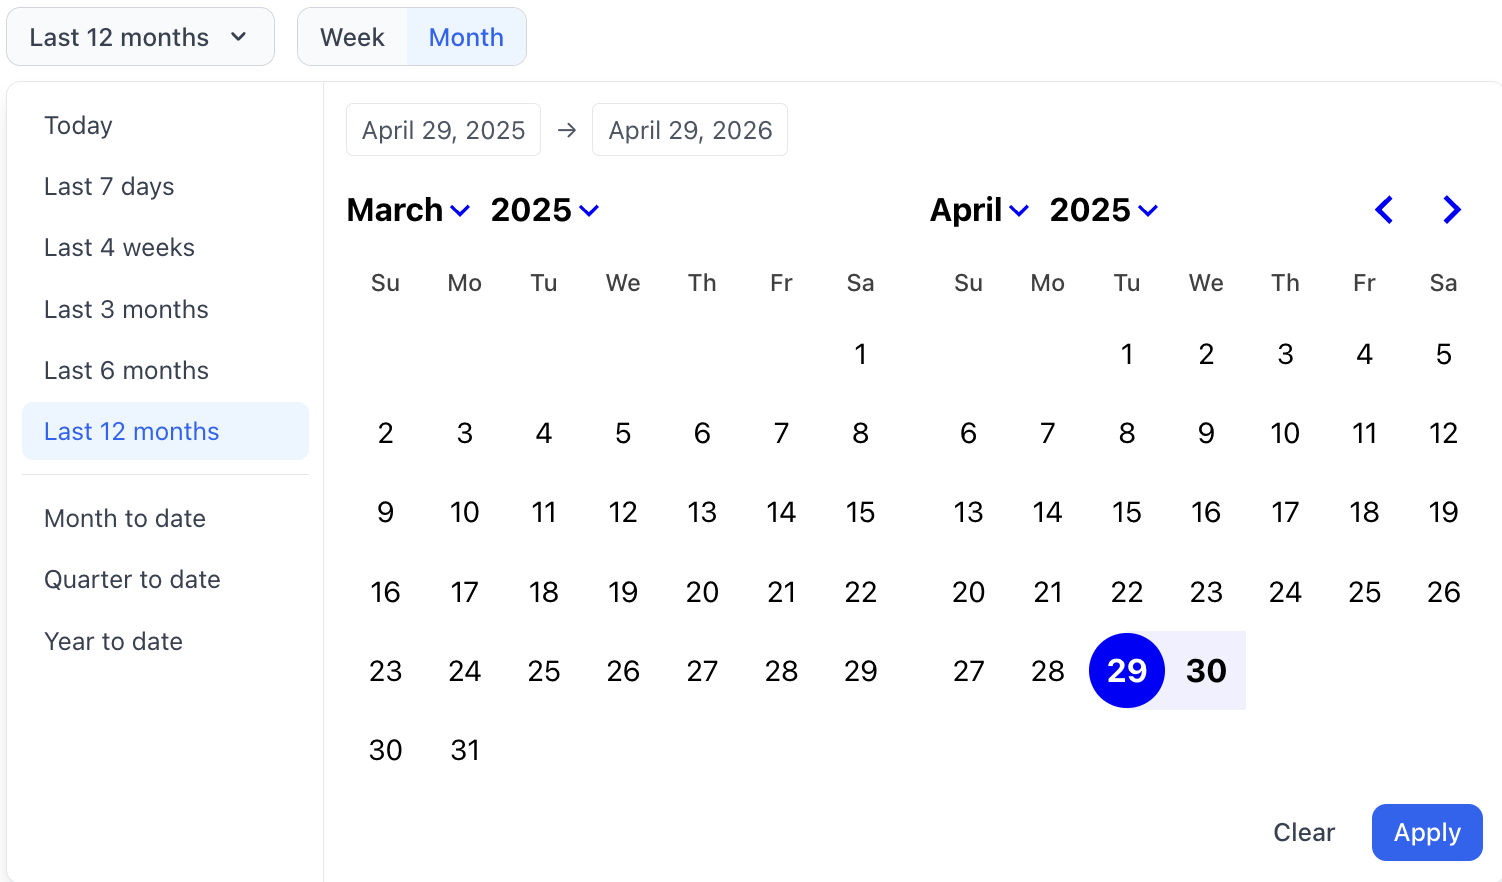
Date Picker
The date picker provides:
- Quick presets — Last week, Last 30 days, Last 6 months (default), Last 12 months
- Inline calendar — Click to pick exact start and end dates for custom ranges
- URL persistence — Your selected date range is saved in the URL, making it easy to bookmark or share specific report views
Troubleshooting
Data Not Showing
Check:
- Date range is correct
- Filters aren't excluding data
- Data may take a moment to process
Numbers Don't Match
Consider:
- Different time zones
- Pending vs completed transactions
- Different report definitions
- Refunds — the Sales report counts payments only and does not subtract refunds; the Transactions report does
- Tax — the Sales report includes tax; the Transactions report's "Net Revenue (after taxes)" removes it
Report Loading Slowly
Try:
- Narrow date range
- Reduce grouping granularity
- Check internet connection
Related Topics
- Dashboard & Key Metrics - KPI tracking and review routines
- Payments & Transactions - Financial details
- Adding & Managing Members - Member data
- Check-In Methods - Attendance data
- Class Types & Setup - Class analytics