Dashboard & Key Metrics
Your Finegym dashboard gives you a real-time snapshot of business health. Use it daily to monitor key performance indicators and spot trends early.
Home Dashboard
Location: Dashboard (Home)
The dashboard displays at-a-glance widgets when you log in:
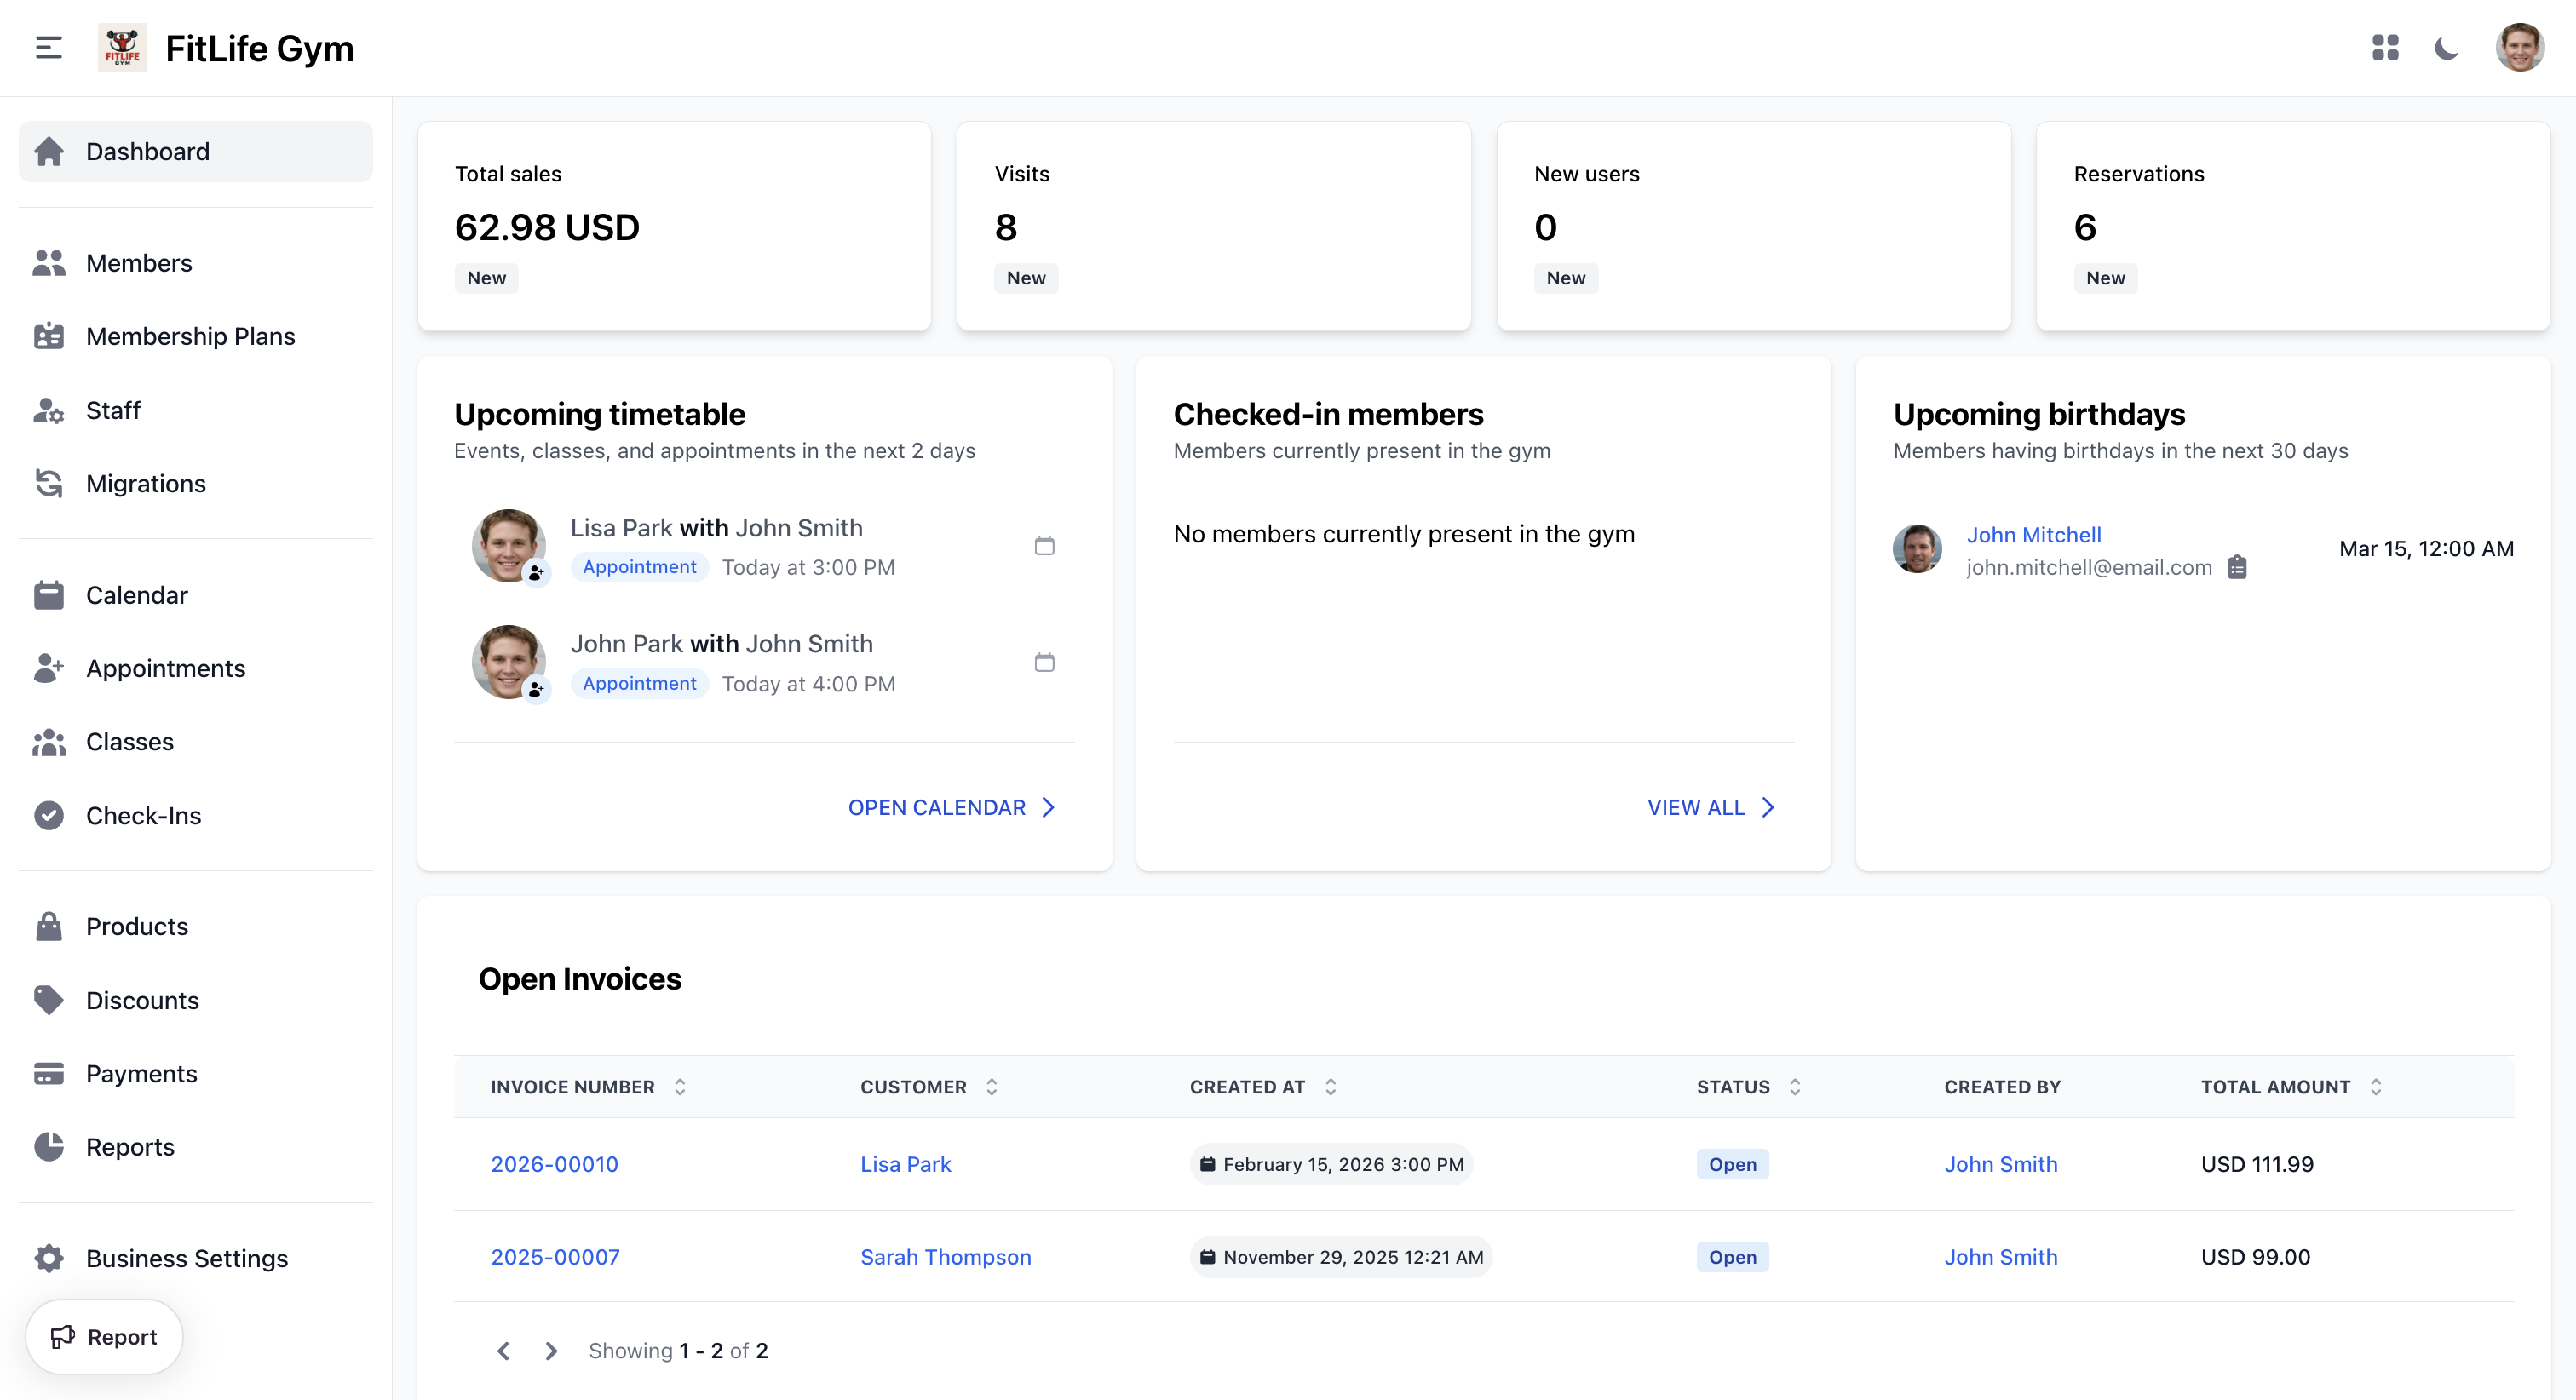
KPI Cards
- Total sales — Revenue total compared to last week
- Visits — Check-in count compared to last week
- New users — New members joined compared to last week
- Reservations — Booking count compared to last week
Each card shows the current value and a percentage change from the previous week.
Additional Widgets
- Upcoming timetable — Classes and appointments in the next 2 days
- Checked-in members — Members currently present in the gym
- At-risk members — Members who haven't checked in within your configured inactivity threshold (see General Settings to configure)
- Recent activity — The latest actions across your gym (member signups, payments, bookings, etc.). See Activity Log for the full log.
- Upcoming birthdays — Members with birthdays in the next 30 days
- Open Invoices — Unpaid invoices awaiting payment
Key Performance Indicators
Member KPIs
- New users — New members joined (Dashboard / Reports → Member Signups)
- Churn Rate — Membership cancellation rate (Reports → Member Signups)
Revenue KPIs
- Total sales — Current income (Dashboard / Reports → Revenue)
- Expected Revenue — Projected recurring income (Reports → Revenue)
Operations KPIs
- Visits — Facility usage (Dashboard / Reports → User Visits)
- Reservations — Booking count (Dashboard / Reports → Reservations)
Building a Review Routine
Daily (2 minutes)
Glance at the dashboard:
- Today's check-ins vs. average
- Any open invoices
- Today's class schedule
Weekly (10 minutes)
Review trends:
- Attendance patterns — are certain days dropping?
- Class fill rates — which classes are consistently full or empty?
- Cancellation rates — any spike in cancellations?
Monthly (30 minutes)
Deep dive:
- Revenue growth — up, down, or flat?
- Member churn — who's leaving and why?
- Referral sources — which channels drive new members?
- Compare to previous month and same month last year
Quarterly (1 hour)
Strategic review:
- Net member growth trend over 3 months
- Revenue trajectory
- Class schedule optimization opportunities
- Pricing review based on demand data
Acting on Your Data
Revenue Declining
- Check churn rate — are you losing members?
- Review pricing — is it competitive?
- Check failed payments — are cards expiring?
- Look at referral sources — is acquisition slowing?
Low Attendance
- Optimize class schedule based on peak hours
- Remove underperforming class times
- Add capacity to popular time slots
- Send reminders to reduce no-shows
High Churn
- Survey departing members
- Review the first 30 days experience
- Check if pricing aligns with value
- Consider loyalty perks for long-term members
High No-Show Rate
- Tighten late cancellation policies
- Enable waitlists for popular classes
- Send class reminders via SMS/push notifications
- Consider limiting advance booking window
Troubleshooting
Dashboard Not Updating
- Refresh the page
- Check your internet connection
- Data may have a brief processing delay
Metrics Seem Wrong
- Verify the date range and filters
- Check for pending vs. completed transactions
- Consider timezone differences between you and the system
Related Topics
- Reports & Exporting - Detailed report breakdowns and data export
- Payments & Transactions - Revenue details
- Attendance Tracking - Check-in data
- Email Templates - Configure automated notifications